
If you read the first part of our series, Baidu SEO for newcomers, we explored…
2017 Statistics on the Chinese cross-border online shopping market
In 2017, the Chinese cross-border online shopping market reached more than ¥110 billion RMB ($17+b USD). By 2021, estimated market size will exceed ¥300 billion RMB ($47+b USD). By any standards that’s an attractive market that’s growing quickly.
To help you get an understanding of who is fuelling this growth, what kinds of products are succeeding with cross-border trade and trends in marketing methods, we’ve put together some nice little charts that will give you a grounding on the basics of Chinese cross-border marketing.
Who purchases cross-border products in China?
According to research, most of cross-border online shopping buyers are from the post-80’s and post-90’s generation, namely ages between 19~23 and 29~39. This accounts for 78% of all the cross-border buyers!

Occupation
Below we can see the kind of professions those buyers are likely to have.

Where are they based?
The buyer geographical distribution closely follows the overall China economic development, as we can see below – Beijing, Shanghai, Guangdong are the most popular province for buying cross-border products. Although combined these provinces make up 35.6% of cross-border purchases, that still leaves 64.4% coming from less developed provinces, showing that broadly speaking there is plenty of growth left to come.
Which products have the top sales for cross-border ecommerce?
Food, Beauty & Makeup and clothing products are leading the way as the most popular cross-border product categories, accounting for 55%, 49% and 48.3% respectively.
Interestingly, looking into the future, buyers are seeking to buy more clothing & bags, digital & household appliances and outdoor supplies via cross-border online shopping.

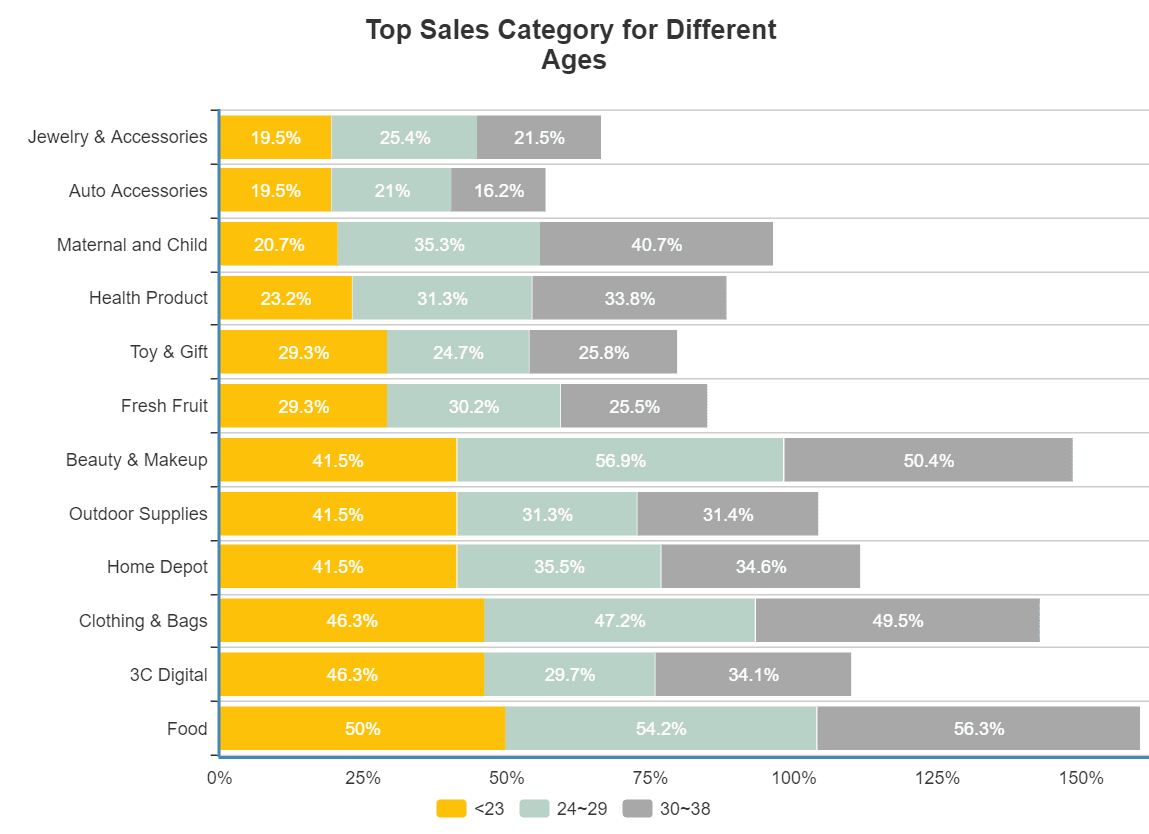
Top sales categories Vs. customer age
Obviously there will be a big different between the different age groups, with younger buyers (19~23) looking for more digital products, and older buyers (24~29 / 30~38) buying more beauty & makeup products.
For the Food category however, all 3 age groups are split equally, check out the chart below.
What are the top selling countries for cross-border sales?
Most sales for cross-border products originate from the western countries shown in the graphic below. Segment this against product category data and we find the following trends…
- Buyers like the beauty & makeup products from Japan and Korea
- Clothing, shoes & bags from USA
- Health product from Australia and New Zealand

Marketing methods that work for cross-border selling
When considering the best marketing practices for your products, you’ll need to create a marketing mix that attracts your customers with different methods. It’s clear from the data, that although discounts are still the most attractive way for the Chinese buyer, content marketing has a strong impact as well.
We can also see selling products through livestreaming comes in at the end at 16.5%, but it also provides an opportunity as a new way to engage with your audience that customers are enjoying at increasing rates.

What factors influence the final purchase decision?
Customers put the most emphasis on the product being 100% certified, they want to know the product they are buying is the real deal. This is even more important than price and delivery. Interestingly 8.2% of those asked, also said the rating for platform/app they are purchasing through is also very important.

Have you got experience or questions with cross-border trade? Let us know in the comments below. Or do you have a product you’d like to bring to the Chinese market? Before taking the leap contact us to discuss the next steps to cross-border selling in China.
Related Posts


This Post Has 0 Comments